Enhancing Nutrient Use Efficiency for Sustainable Agriculture
In this blog post, we begin with the real-world challenge of improving nutrient use efficiency in modern agriculture. We introduce the research gap by showing that although NUE is widely used, its traditional ratio-based definition is statistically flawed. We then highlight the key contribution of this work evaluating alternative statistical models to more accurately quantify nitrogen responsiveness. The post showcases the core results and explains why they matter for sustainable crop management. Finally, we conclude with the broader implications for agricultural research, nutrient stewardship, and future food security.
Introduction and Background
Modern agriculture faces a looming threat of food scarcity and heightened pressure on natural resources to sustain increasing food demand. Improving nutrient use efficiency is crucial to achieving sustainable food production.
One of the most significant changes in agricultural productivity in recent history was the Green Revolution, a period of technological and agronomic advancements that helped sustain the growing world population through the development of input-responsive, high-yielding varieties of wheat and rice. However, the human population is expected to increase to 9.1 billion by 2050. To sustain this growing population, food production will need to increase substantially. Therefore, modern agriculture faces the dual challenge of meeting rising food demand while operating under the constraints of limited land, water, and nutrient resources.
In the wake of growing environmental and economic concerns, optimum nutrient management is of paramount importance. Fertilizer cost is a key consideration for farmers when gauging economic returns.
Nitrogen is essential for agriculture because it is a key component of plant growth, protein synthesis, and photosynthesis, which together boost crop yield and quality. However, reliance on large amounts of nitrogenous fertilizers is environmentally hazardous and has resulted in serious perturbation of the global nitrogen cycle. This progressively deteriorating situation has prompted the goal of developing fertilizer-efficient crop plants. It has also shifted the primary objective from simply increasing food production to achieving sustainable food production, placing a premium on improving Nitrogen Use Efficiency (NUE) in cropping systems.
Nitrogen use efficiency (NUE) is commonly defined as a measure of how effectively a plant uses nitrogen to produce yield, often calculated as crop yield or biomass divided by the amount of nitrogen applied. There exist several approaches for improving NUE in plants, including genetics-based strategies (developing varieties that use nitrogen more efficiently) and management-based strategies (optimizing how, when, and where nitrogen is applied).
One key management consideration is applying the right rate of fertilizer at the right place. Spatial soil variability plays a central role here. Soil is a dynamic natural resource that is highly heterogeneous in its properties. Two important classes of soil heterogeneity are lithological heterogeneity the distribution of different lithological layers in a soil matrix and inherent soil heterogeneity, which reflects the distribution of soil properties across the soil profile. Among landscape features, soil type and topography are two of the most important determinants of soil variability. In addition to these permanent landscape features, variable factors such as temporal variability in precipitation also interact with patterns of spatial soil variability.
Given the limited availability of readily accessible soil nitrogen (N) and the high cost of synthetic nitrogenous fertilizers, nitrogen use efficiency becomes central to the effectiveness of any management practice aimed at sustainable agriculture. In this context, NUE often defined as the ratio of grain productivity to available soil nitrate (AN) emerges as a key metric for evaluating the effectiveness of nutrient management in sustainable cropping systems.
Problem Definition:
Although NUE is widely used in agronomic research and crop management, its calculation as a simple ratio of yield to nitrogen input presents important statistical limitations. Ratio-based metrics can distort relationships between variables, mask true treatment effects, and lead to misleading conclusions about nitrogen responsiveness. These issues highlight the need for more robust analytical approaches to accurately assess nitrogen use efficiency.
Statistical and practical limitations can hamper the accurate assessment of NUE. Defining NUE as a ratio of grain yield to any measure of nitrogen here, available soil nitrate (AN) is deceptively simple and can lead to inaccurate or misleading conclusions. This project investigates the statistical challenges inherent in treating NUE as a ratio by comparing its behavior under different analytical and regression models. By examining ratio-based analyses alongside linear, quadratic, and piecewise regression approaches, we aim to identify the most reliable method for estimating NUE. Ultimately, we ask: Given the limited availability of plant-accessible soil nitrogen and the high cost of synthetic fertilizers, how can NUE be measured in a way that is both statistically sound and agronomically meaningful?
Our Approach:
Experiment Sites
This project was conducted across three commercial sites located north of Edmonton in Sturgeon County, Alberta, Canada. All sites are predominantly characterized by moderately fine-textured Black Chernozemic soil, with an average growing season precipitation of 286 mm and a mean growing season temperature of 2.67 °C. Each site is managed under conventional tillage and used for arable cropping. A rotation of wheat (Triticum aestivum L.), canola (Brassica napus L.), and field pea (Pisum sativum L.) is followed at the Bert site (53°51'13.4"N, 113°14'06.8"W), while a wheat–canola rotation is used at the Brad (53°51'41.6"N, 113°14'49.3"W) and Lamoureux (53°50'06.5"N, 113°12'14.5"W) sites (Figure 2.1). Variable rate urea (46-0-0) applications for 2015 at the Bert and Lamoureux sites are shown in Figure 2.2, with green, yellow, and red pixels representing different application rates.
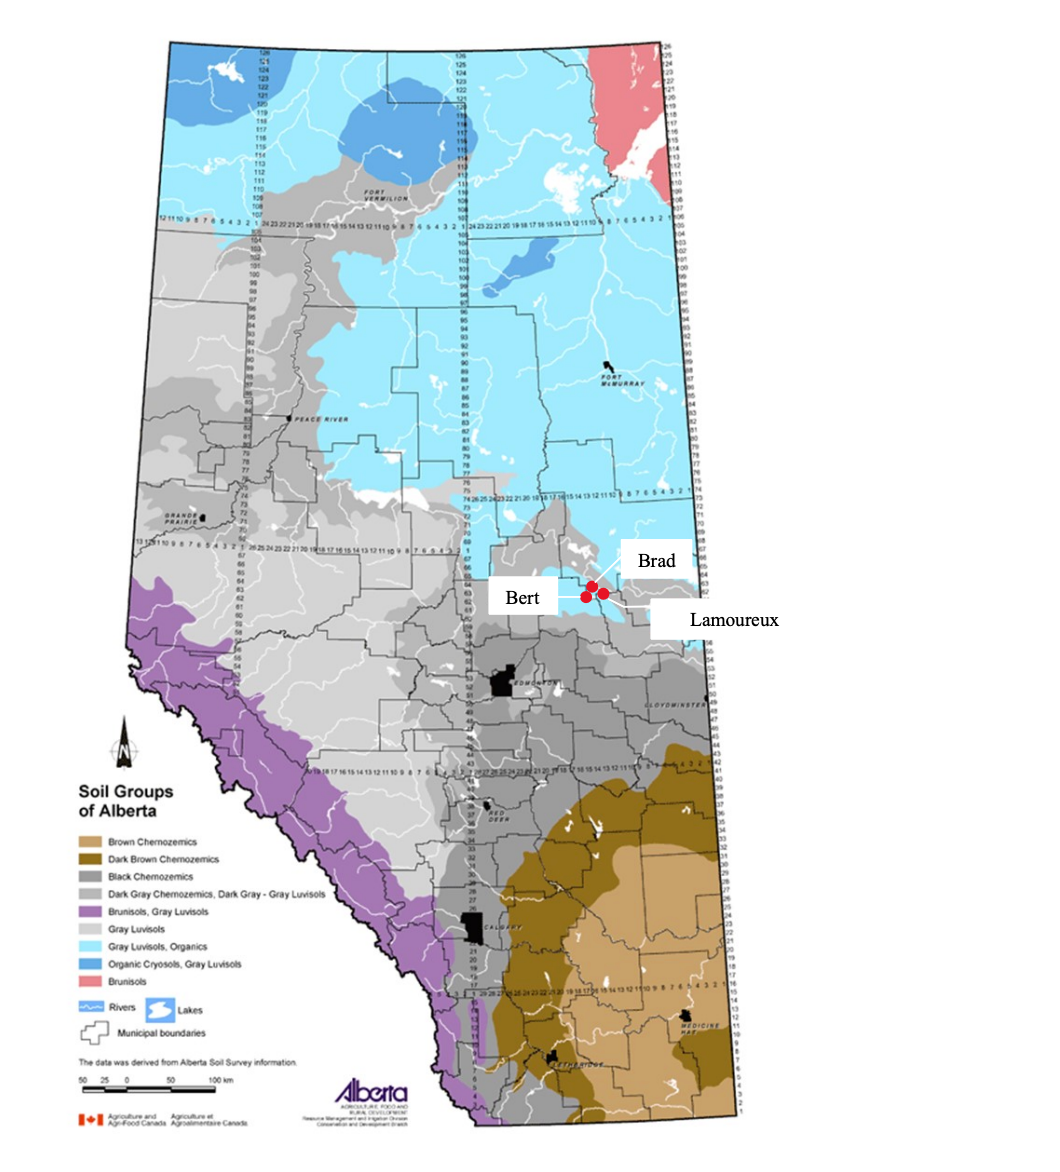
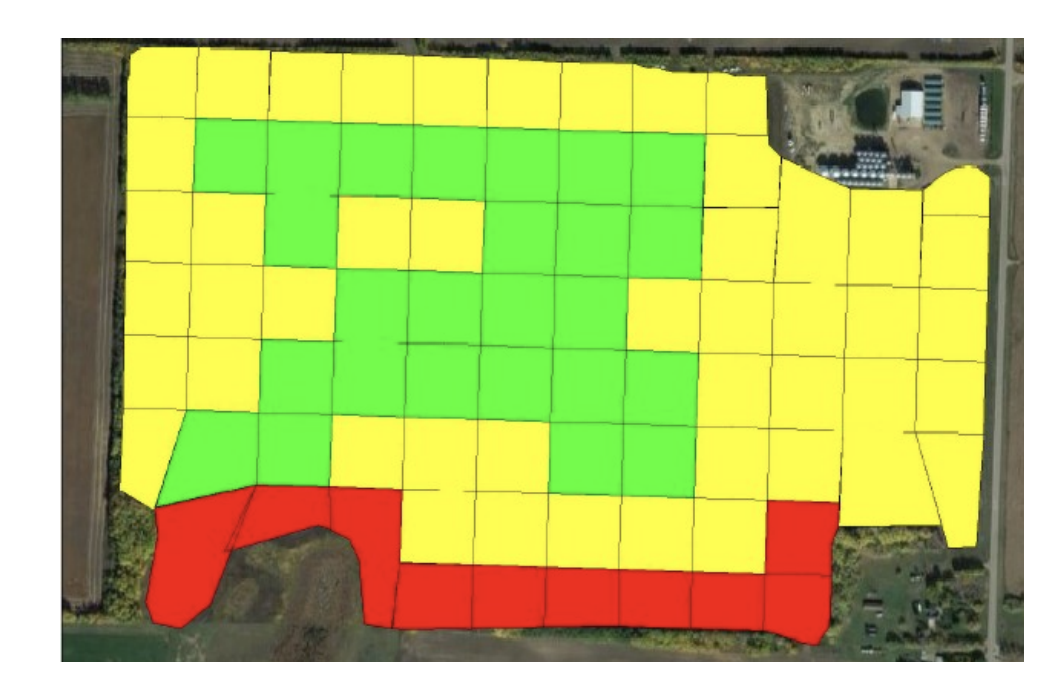
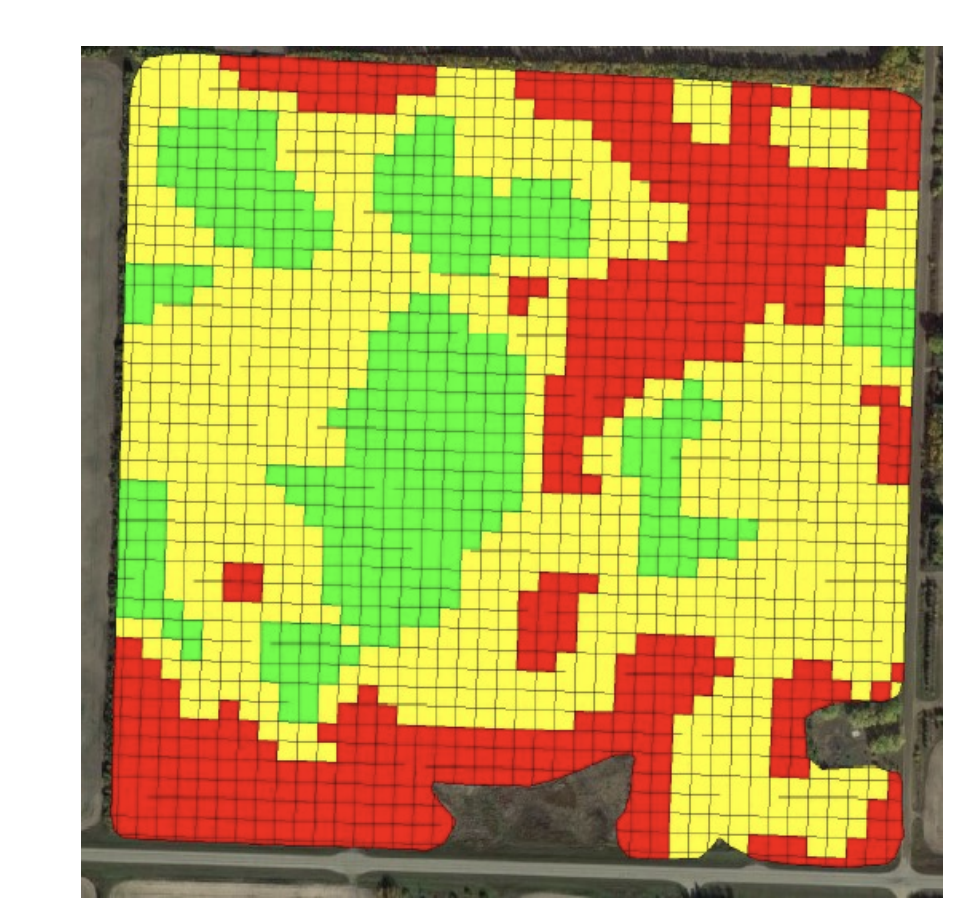
Figure 2.1. Map showing soil groups of Alberta. The geographic location of three study sites is indicated by red dots. Image courtesy: Alberta Agriculture and Forestry. Figure 2.2 (a). Variable rate application of urea (46-0-0) to the Bert site for year 2015. Green, yellow and red pixels illustrate 120, 100, and 87 lbs ac-1 of applied urea. Figure 2.2 (b). Variable rate application of urea (46-0-0) to the Lamoureux site for year 2015. Green, yellow and red pixels illustrate 76, 65, and 54 lbs ac-1 of applied urea.
Grain Productivity and Soil Data
Wheat grain productivity was recorded in September 2015 using a Green Star™ 3 yield monitor mounted on a combine harvester. Moisture and grain flow sensors were calibrated prior to harvest. Wet and dry grain volume (kg ha⁻¹) was recorded at geo-referenced locations across the fields.
In early June 2015, 2-ha sampling grids were established at each site, and 30 soil samples were collected per grid using a tractor-mounted Auto-Probe™ at a depth of 0–15 cm. Samples from each grid were homogenized to form a representative composite, and subsamples (~50 g) were stored at 4 °C. These samples were analyzed at Midwest Labs for available soil nitrate (AN), phosphorus (AP), and potassium (AK). AP was measured using the P1 (weak Bray) method, AK using neutral ammonium acetate extraction, and AN using flow injection analysis. Soil N (applied fertilizer + available soil N) and wheat yield distributions for the Lamoureux and Brad sites in 2015 are shown in the accompanying figures.
(Left) Soil N (applied N fertilizer and available soil N) and measured wheat yield at the Lamoureux site in 2015. Canola was grown in 2014 at this site (Right) Soil N (applied N fertilizer and available soil N) and measured wheat yield at the Brad site in 2015. Canola was grown in 2014 at this site.
Ratio and Statistical Analysis of NUE
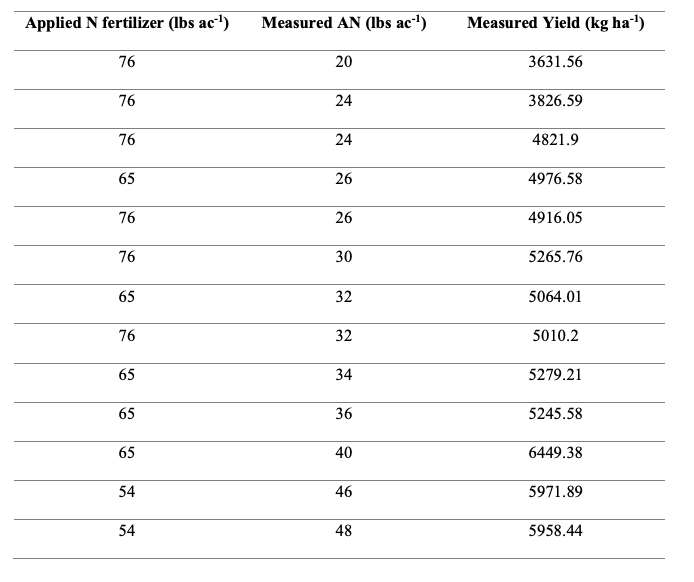
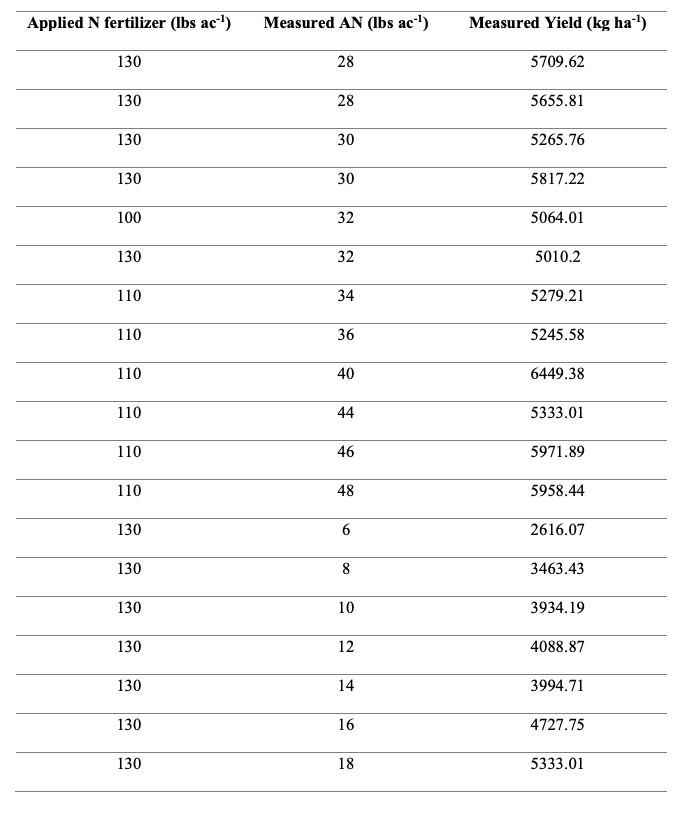
NUE was initially computed as a ratio of grain yield (y) to available soil nitrate (AN) (x), as presented in Table 2.4. This helped highlight several of the statistical challenges associated with ratio-based metrics. All analyses were conducted in R (R Core Team, 2017).
The relationship between grain yield and AN was explored through multiple regression approaches. Before fitting linear models, normality was evaluated using the Shapiro–Wilks test. A linear regression (LR) model I (ordinary least squares),

was fitted (Figure 2.3), with diagnostic checks for model fit shown in Figure 2.4. Residual normality and homoscedasticity were assessed using the Shapiro–Wilks and Breusch–Pagan tests, respectively.
To account for sampling error in the explanatory variable, LR model II was applied (Figure 2.3), estimating slopes using major axis (MA), standard major axis (SMA), and ranged major axis (RMA) methods. The grain yield–AN relationship was further analyzed using quadratic regression (QR) and piecewise regression (PWR) models (Figure 2.5).
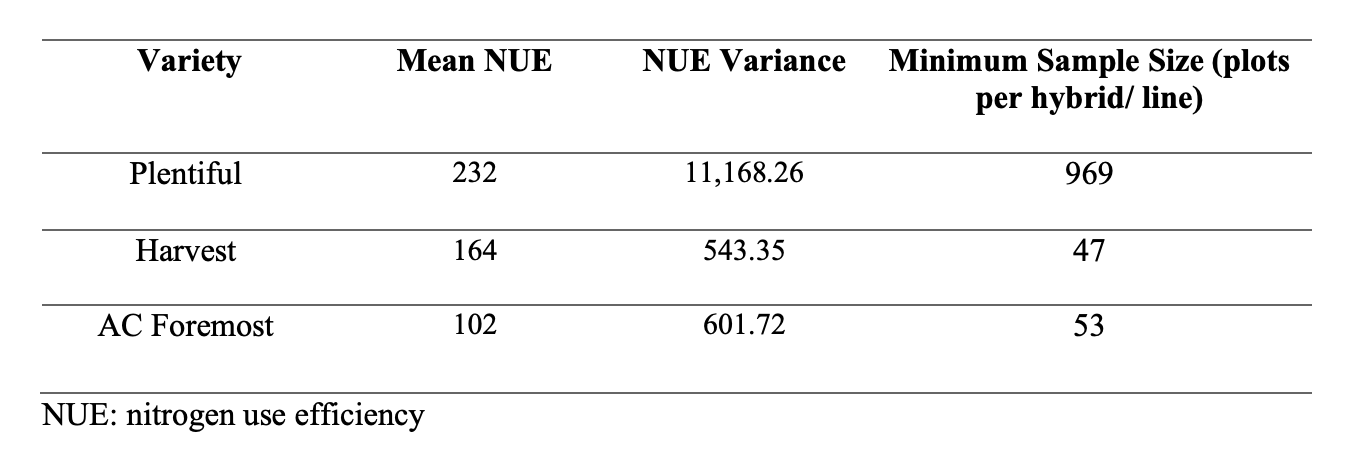
Statistical power considerations were also evaluated. The minimum number of sampling units required to detect a specified effect size was calculated using the formula shown, where N is the total sample size, σ² is variance, and D is the minimum detectable difference expressed as a percentage. A Z₍crit₎ of 0.05 and power of 80% (β = 0.8) were used. The estimated number of samples required to detect a 10% difference in NUE relative to the variety AC Andrew is reported.
Sampling Units
The minimum number of sampling units required to study a certain effect size with a specified statistical power were calculated using the following formula:

Where N is the sum of sample sizes for both varieties, σ2 is the variance, and D is the minimum expected difference between varieties expressed as a percentage. Z power (Zpwr) and Z critical (Zcrit) are the statistical power, and significance criterion used for this analysis. I chose conventional Zcritof 0.05.
Results Overview:
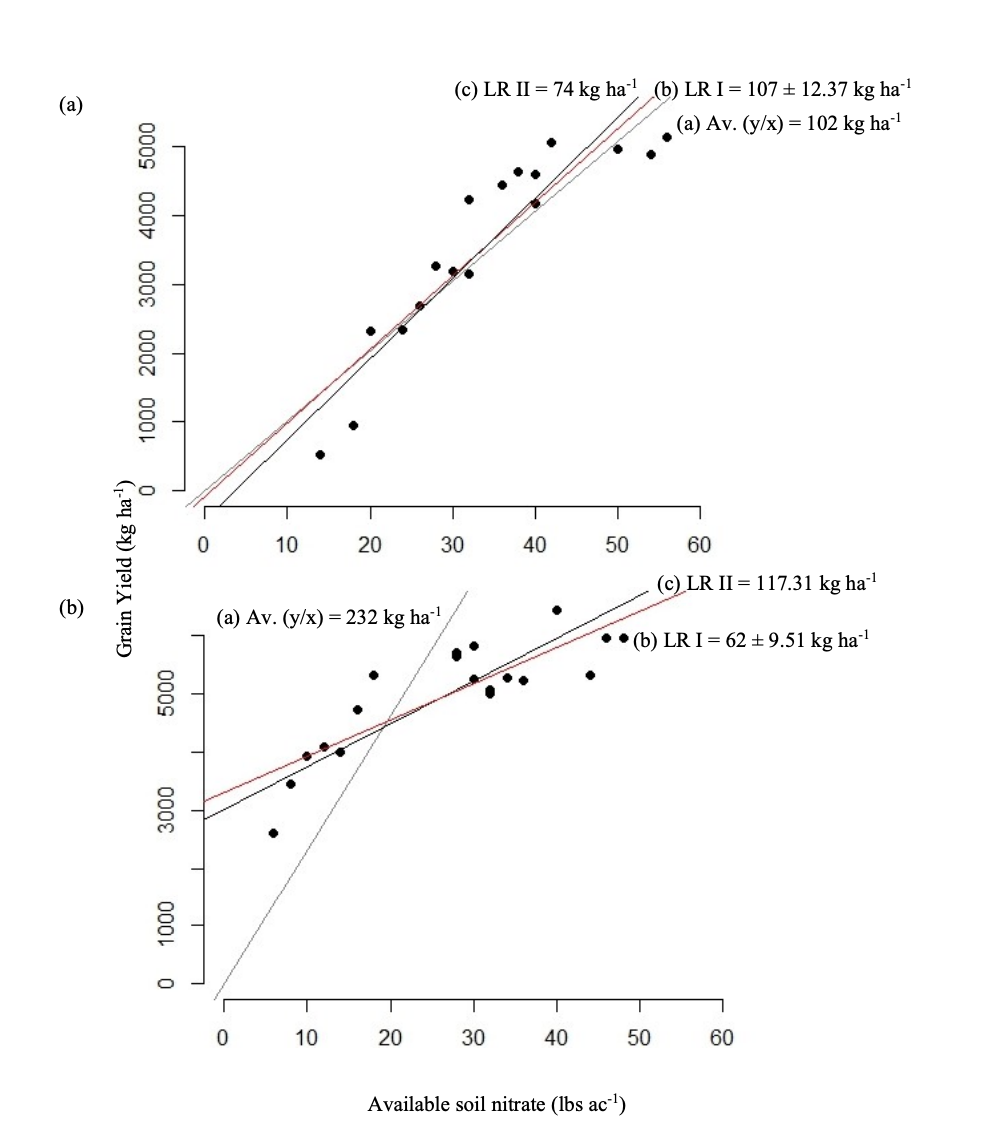
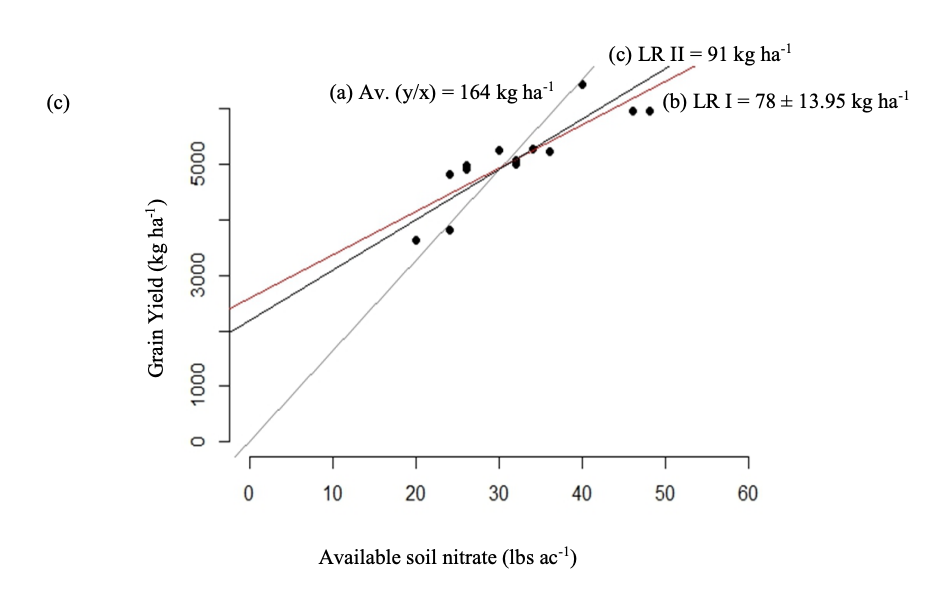
Figure 2.3. Exploration of the relationship between available soil nitrate (AN) and wheat grain yield for the Bert (a), Brad (b), and Lamoureux (c) sites
Figure 2.3 illustrates the relationship between AN and grain yield for the three sites. Line A (gray) shows increases of 102, 232, and 164 kg ha⁻¹ per lb ac⁻¹ of AN at the Bert, Brad, and Lamoureux sites, respectively. Lines B (red) and C (black) show slope estimates from LR model I and LR model II, highlighting notable differences between methods.
Regression diagnostic plots:
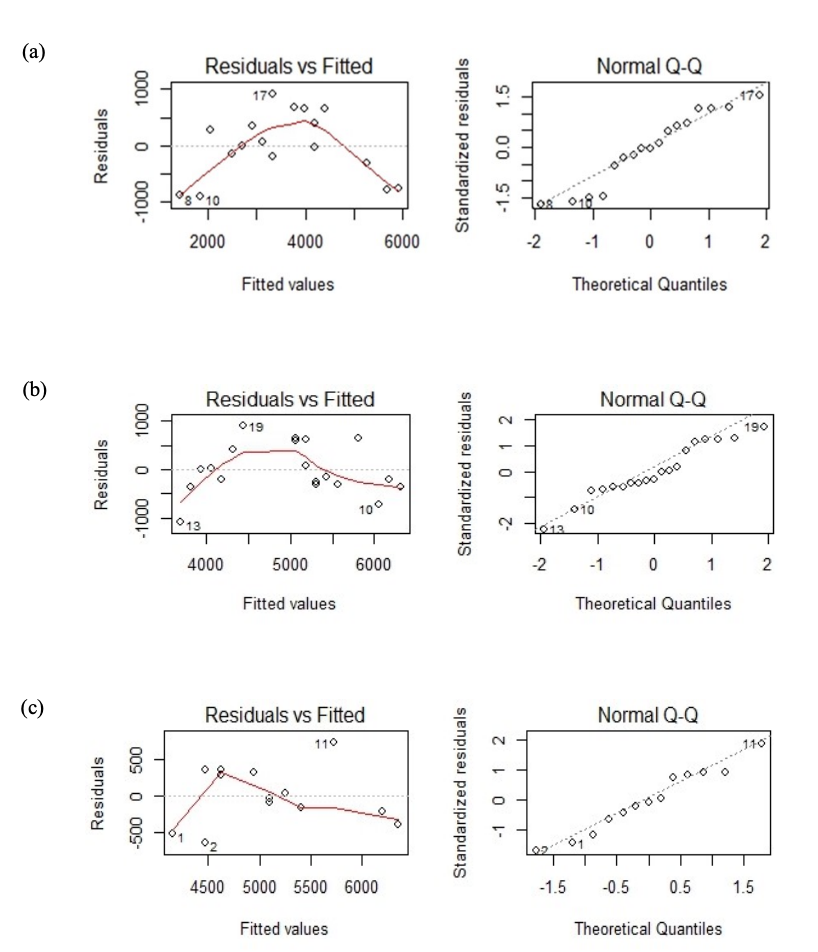
Regression diagnostic plots (Figure 2.4) reveal patterns in residual dispersion that violate linearity assumptions, indicating that linear models do not perform well for these data. Q-Q plots show that residuals are approximately normally distributed.
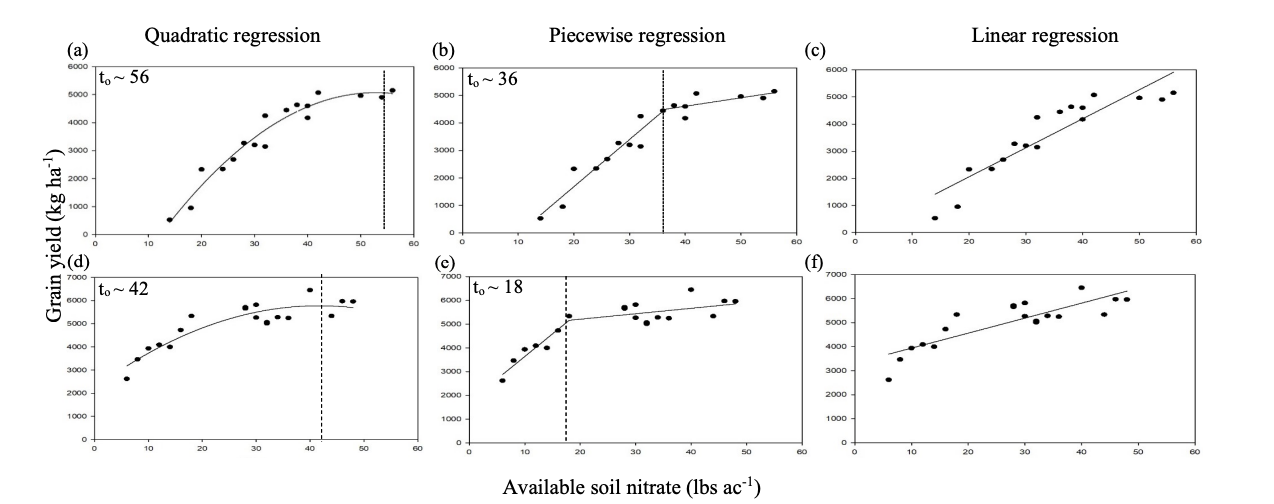
Figure 2.5 presents the modeling results for NUE using LR, QR, and PWR across all sites. Quadratic regression was found to best characterize the relationship between grain yield and AN, capturing the true curvature of the yield response. The first derivative of the quadratic equation provides an agronomically relevant estimate of NUE.
Conclusion
This chapter highlights the statistical limitations of defining nitrogen use efficiency (NUE) as a simple ratio of grain yield to available nitrogen. Ratio-based analyses assume isometry a condition not supported by the data and can lead to misleading conclusions. By comparing multiple statistical approaches, the study demonstrates that regression-based methods, particularly quadratic regression (QR), provide a more reliable way to characterize yield response to soil nitrate and to estimate agronomically and economically optimal nitrogen rates.
The analysis also shows that distinguishing genotypes for NUE requires very large sample sizes, presenting practical challenges for field experimentation. Beyond NUE estimation, geostatistical comparisons ordinary kriging, cokriging, and regression kriging were used to explore spatial variability in soil fertility. Ordinary kriging generally performed best for predicting available soil nutrients, while regression kriging improved estimates for properties such as cation exchange capacity, pH, and organic matter. Landscape position, however, did not strongly influence soil fertility or yield in these sites.
Overall, the findings underscore the complexity of analyzing nutrient use efficiency and the importance of robust statistical tools and thoughtful experimental design. By pairing improved statistical modelling with a deeper understanding of spatial soil variability, this work contributes to more precise and sustainable nitrogen management in modern cropping systems.